graphy.plotting - Module with graphical plotting functions
- graphy.plotting.plot_graph(G, pos=None, colors=None, node_labels=None, node_size=0.04, edgescale=1.0, nodeopts={}, labelopts={}, arrowopts={}, bidir_arrows=True, cmap='Paired', vmin=None, vmax=None)[source]
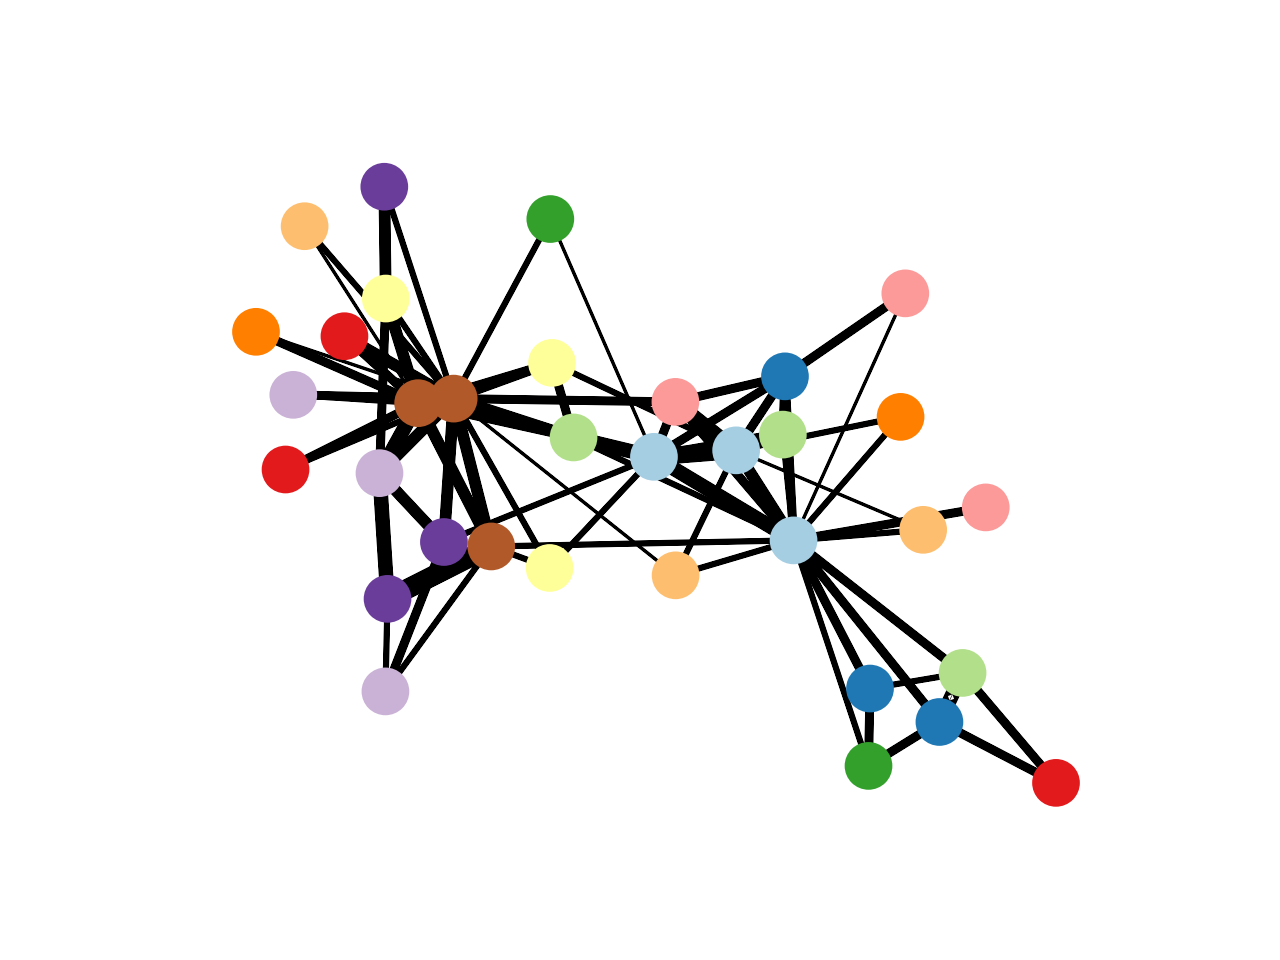
Plot a graphs. Supports both directed and undirected graphs. Undirected edges are drawn as lines while directed edges are drawn as arrows.
For example:
>>> from graphy import plotting
>>> import networkx as nx
>>> G=nx.karate_club_graph()
>>> plotting.plot_graph(G, pos=nx.spring_layout(G), colors=range(G.number_of_nodes()))
(
Source code,png,hires.png,pdf)
- Parameters:
- Gnetworkx Graph object or 2-d np.array
Graph to plot, either instance of networkx Graph or a 2-d connectivity matrix.
- posdict
Dict specifying positions of nodes, as in {node: (x,y). If not provided, nodes are arranged along a circle.
- colorslist of ints or list of RGBA values (default None)
Color(s) to use for node faces, if desired.
- node_labelslist of strings (default None)
Labels to use for node labels, if desired.
- node_sizefloat (default 0.05)
Size of nodes.
- edgescalefloat (default 1.0)
Controls thickness of edges between nodes.
- nodeoptsdict (default {})
Extra options to pass into plt.Circle call for plotting nodes.
- labeloptsdict (default {})
Extra options to pass into plt.text call for plotting labels. Could be used to specify fontsize, for example.
- arrowoptsdict (default {})
Extra options to pass into plt.arrow call for plotting edges.
- bidir_arrowsbool (default True)
Whether to draw arrowheads when graph is directed and two nodes are connected bidirectionally.
- cmapstring (default ‘Paired’)
Name of colormap to use.
- vminfloat (default is minimum of colors)
Starting value to use for colormap.
- vmaxfloat (default is minimum of colors)
Ending value to use for colormap.