graphy.graphgen - Module to generate structured graphs
Module implementing tools to generate graphs and connectivity matrices.
Generally, gen_... functions return generatively-created objects, while
get_... return graphs corresponding to passed in membership vectors.
Use sample_connection_matrix to generate binary connectivity matrices
sampled from matrices of connection probabilities.
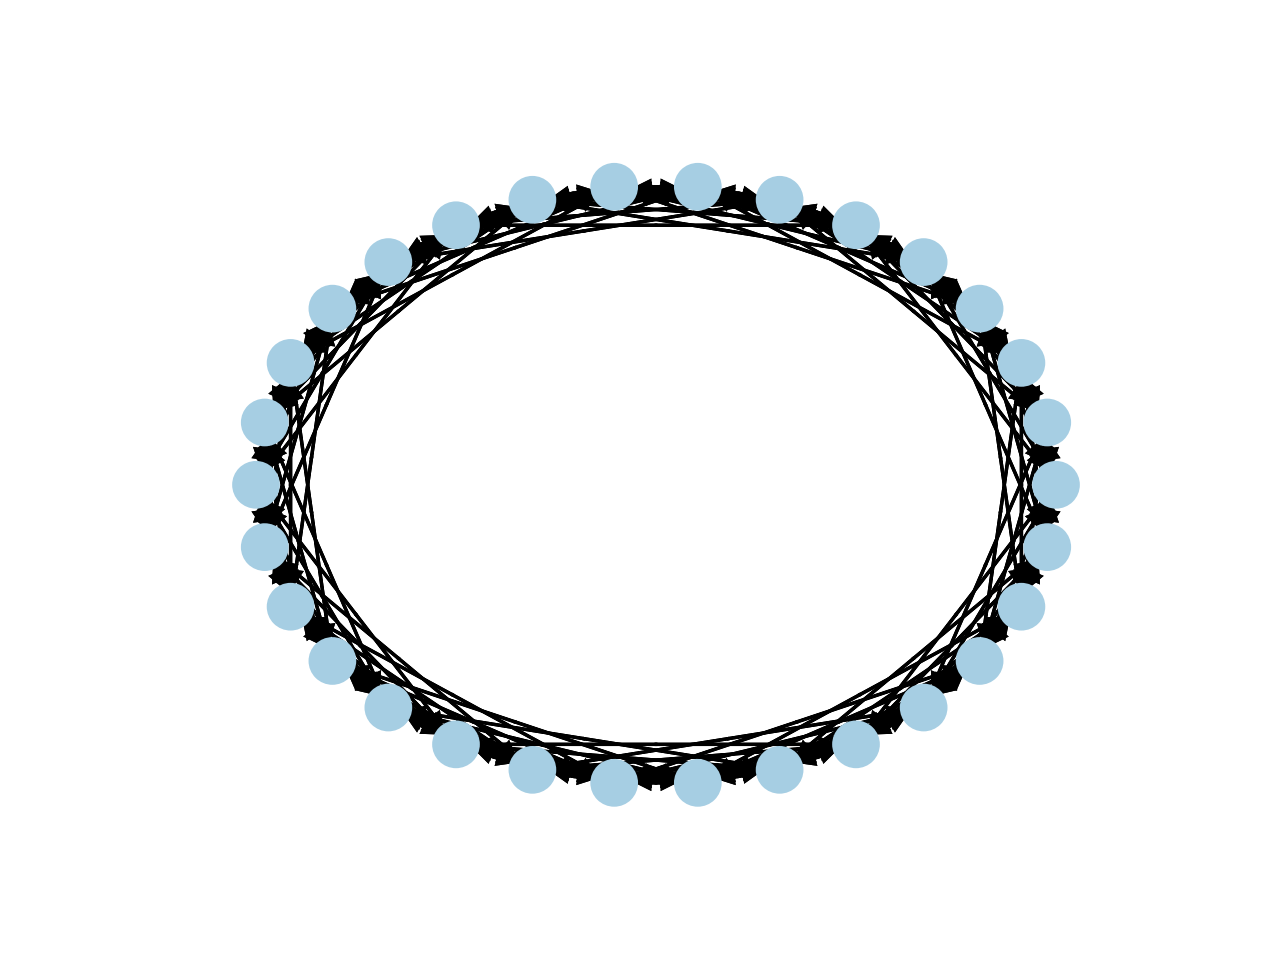
- graphy.graphgen.gen_ring_matrix(N, neighs_per_side=1)[source]
Generate a ring-lattice matrix.
For example:
>>> import graphy
>>> mx = graphy.graphgen.gen_ring_matrix(30, 5)
>>> graphy.plotting.plot_graph(mx)
(
Source code,png,hires.png,pdf)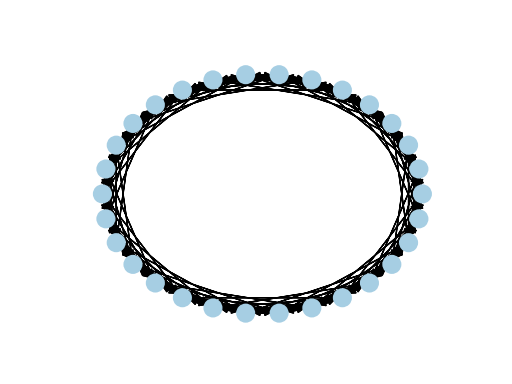
- Parameters:
- Nint
How many nodes.
- neighs_per_sideint
How many neighbors on each side should be connected to each node.
- Returns:
- np.array matrix
The connectivity matrix
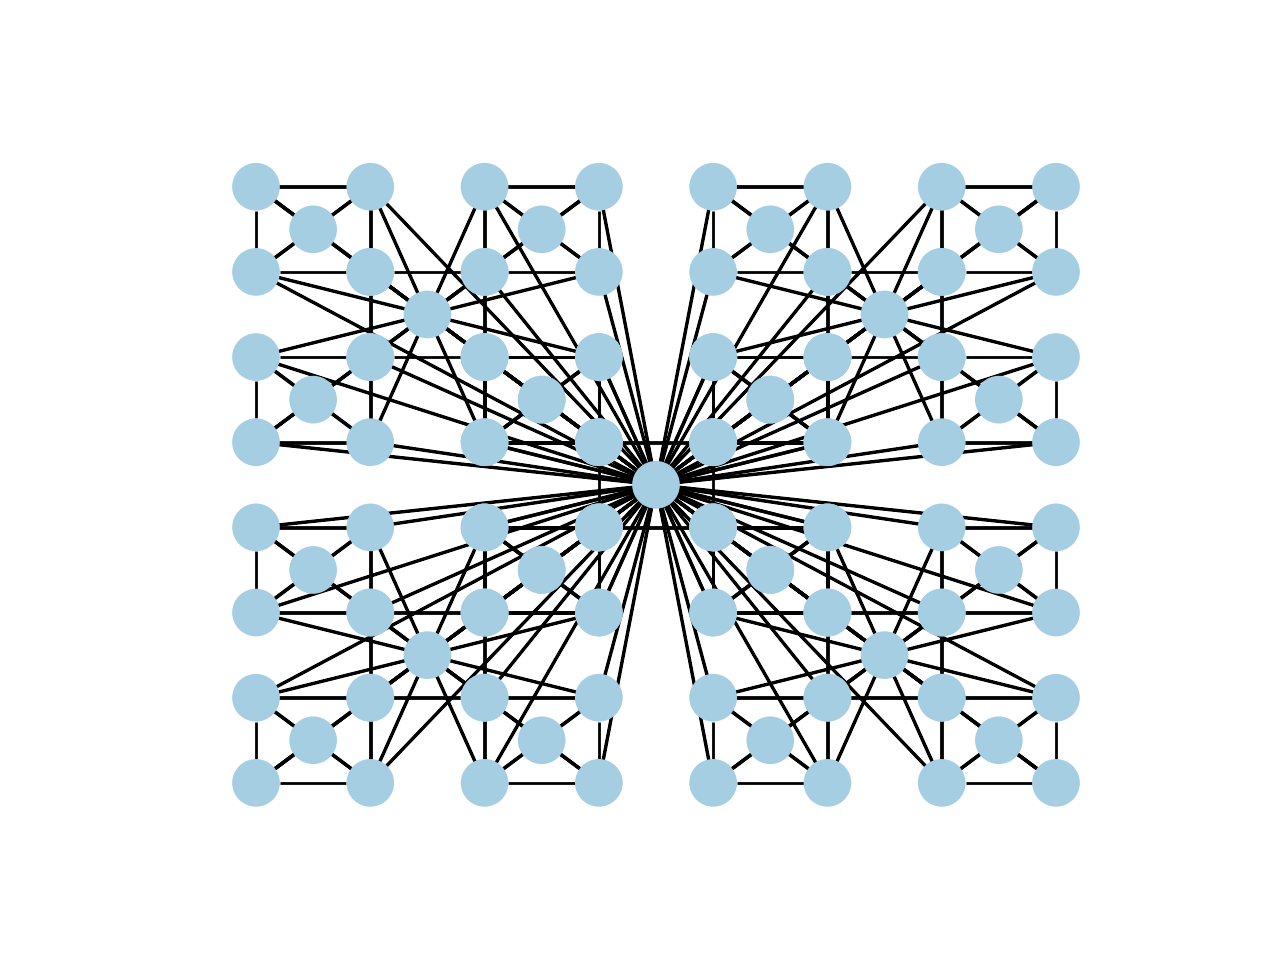
- graphy.graphgen.get_clique_of_rings_net_and_pos(sizes, neighs_per_side=1, ring_weight=1.0, clique_weight=1.0)[source]
Generate several ring-lattice graphs of different sizes. Then choose a single node from each ring and interconnect those into a clique.
>>> import graphy
>>> net, pos = graphy.graphgen.get_clique_of_rings_net_and_pos([5, 10, 20])
>>> graphy.plotting.plot_graph(net, pos=pos)
(
Source code,png,hires.png,pdf)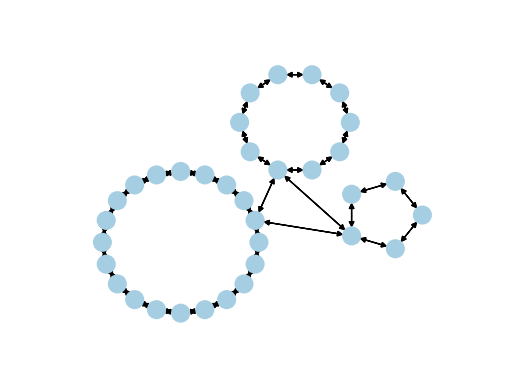
- Parameters:
- sizeslist of int
How many nodes in each ring.
- neighs_per_sideint or list (default 1)
For nodes in ring lattices, how many neighbors on each side to connect to. If list, specifying the neighbors on each side within the corresponding ring.
- ring_weightfloat (default 1.0)
Strength of connections in each ring lattice.
- clique_weightfloat (default 1.0)
Strength of connections in clique connecting single nodes in each ring.
- Returns:
- networkx graph
The clique of rings network
- dict
{ node : xyposition } dictionary of positions for good node layout
- graphy.graphgen.gen_hierarchical_net(n, level)[source]
Generate hiearchical graph using method proposed of: Ravasz E, Barabasi AL, Hierarchical organization in complex networks, PRE, 2003.
- Parameters:
- nint
Number of nodes in the lowest level.
- levelint
Number of hierarchical levels to create
- Returns:
- networkx graph
The hierchically-structured network
- graphy.graphgen.get_hierarchical_net_pos(net)[source]
Get x,y positions for plotting hierarchical graph.
For example:
>>> import graphy
>>> G = graphy.graphgen.gen_hierarchical_net(5, 2)
>>> pos = graphy.graphgen.get_hierarchical_net_pos(G)
>>> graphy.plotting.plot_graph(G, pos=pos)
(
Source code,png,hires.png,pdf)
- Parameters:
- netnetworkx graph
Graph whose nodes to layout
- Returns:
- dict
Dictionary containing node:(x,y) entries
- graphy.graphgen.sample_connection_matrix(prob_mx)[source]
Sample from a matrix of connection probabilities in order to create a binary connection matrix with 0s on the diagonal.
- Parameters:
- prob_mx2-dimensional np.array of floats
Matrix of connection probabilities
- Returns:
- 2-dimensional np.array
Binary connectivity matrix
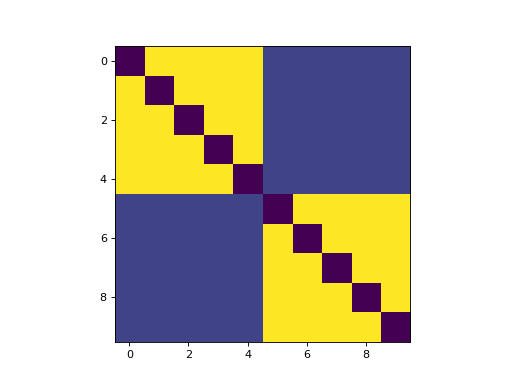
- graphy.graphgen.get_weighted_block_matrix(membership, intra_community_w, inter_community_w)[source]
Get weighted block-structured matrix corresponding to membership vector with different weights for intra- versus inter-community connections, and 0s on the diagonals.
For example:
>>> from graphy import graphgen
>>> cmx = graphgen.get_weighted_block_matrix([0,0,0,0,0,1,1,1,1,1], 0.5, 0.1)
>>> plt.imshow(cmx, interpolation='none')
(
Source code,png,hires.png,pdf)
- Parameters:
- membershiplist or np.array of ints
Array containing assignment of each node to communities
- intra_community_wfloat
Weight for intra-community connections
- inter_community_wfloat
Weight for inter-community connections
- Returns:
- np.array matrix
The connectivity matrix
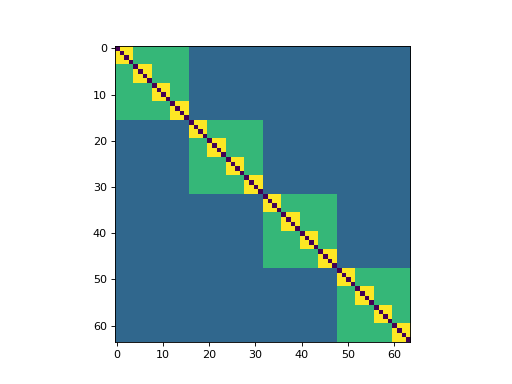
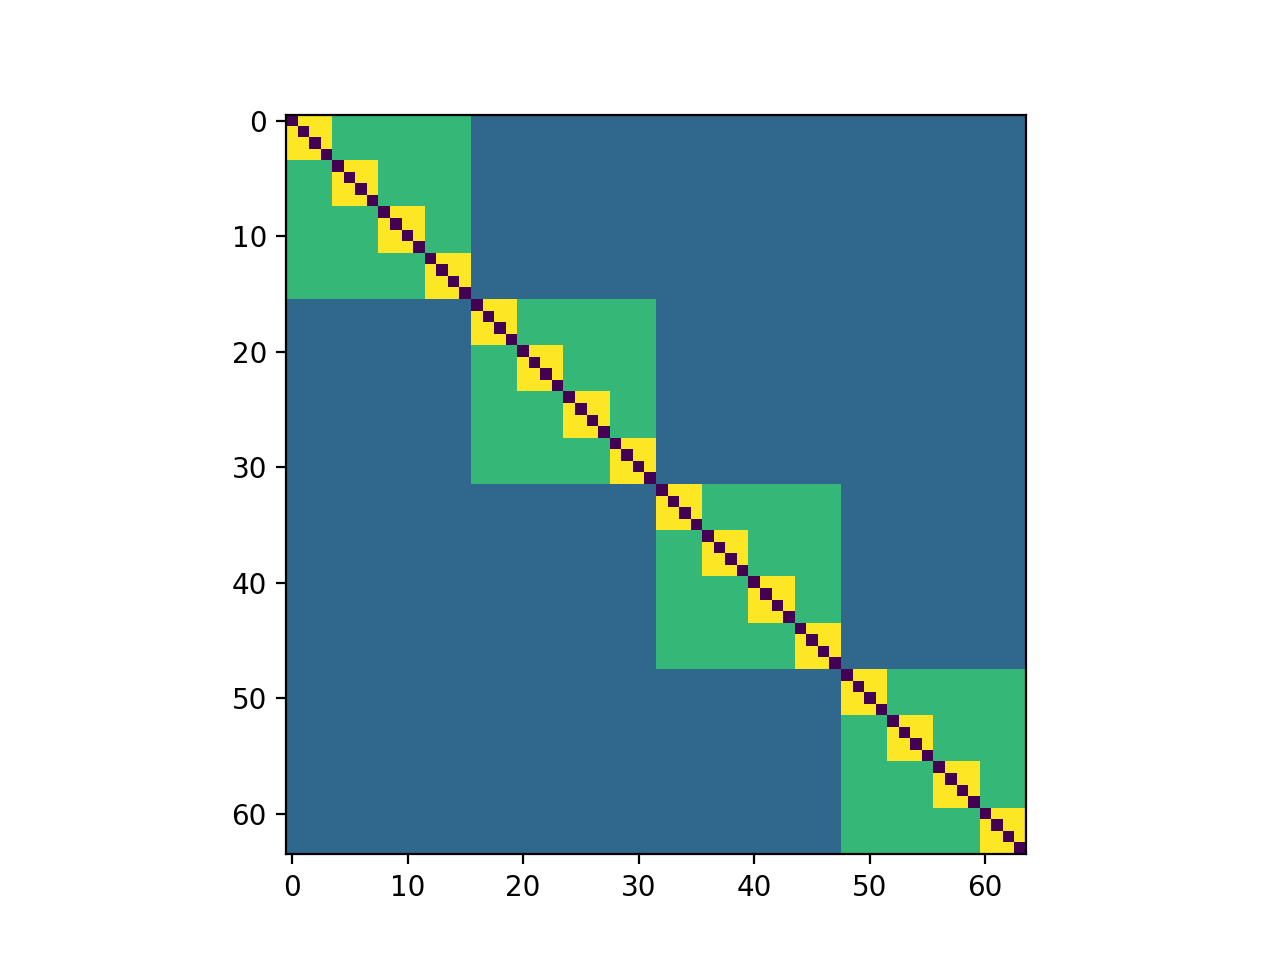
- graphy.graphgen.gen_hierarchical_weighted_block_matrix(blocksize, numblocks, numlevels, level_weights)[source]
Generate hierarchical weighted block matrix.
For example:
>>> from graphy import graphgen
>>> cmx = graphgen.gen_hierarchical_weighted_block_matrix(4, 4, 2, [0.3, 0.2, 0.1])
>>> plt.imshow(cmx, interpolation='none')
(
Source code,png,hires.png,pdf)
- Parameters:
- blocksizeint
Number of nodes to include in each lowest-level block
- numblocksint
Number of blocks each level consists of
- numlevelsint
Number of levels
- level_weightslist of float
Strength of connection between members for each level (plus one more for the ‘top’ level). Order is from lowest-level (smallest blocks) to highest-level
- Returns:
- np.array matrix
The generated connectivity matrix
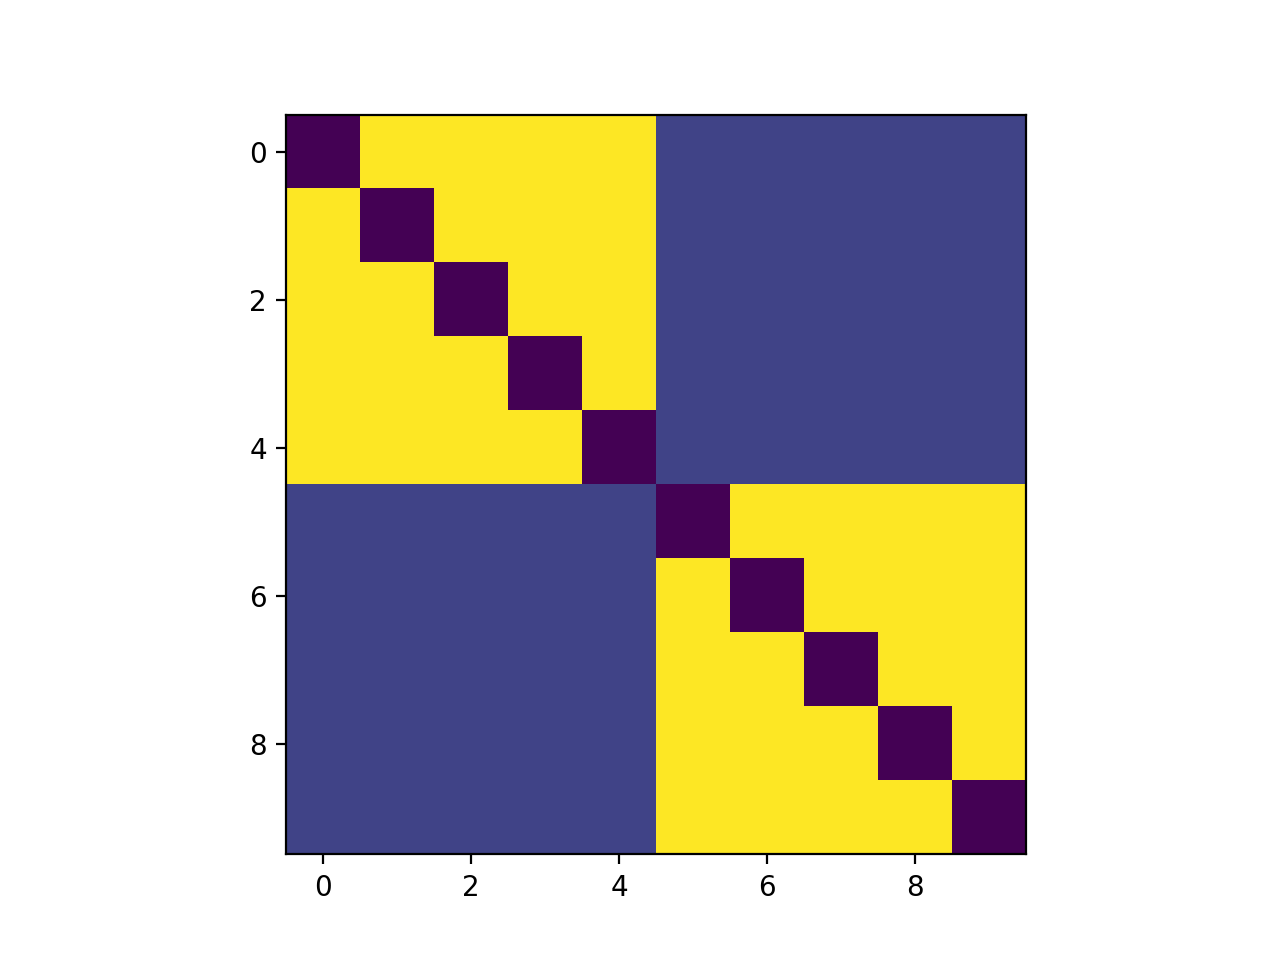
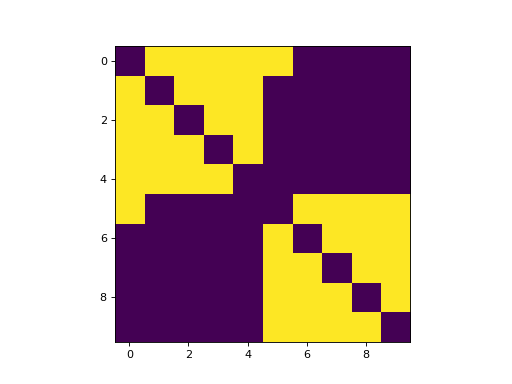
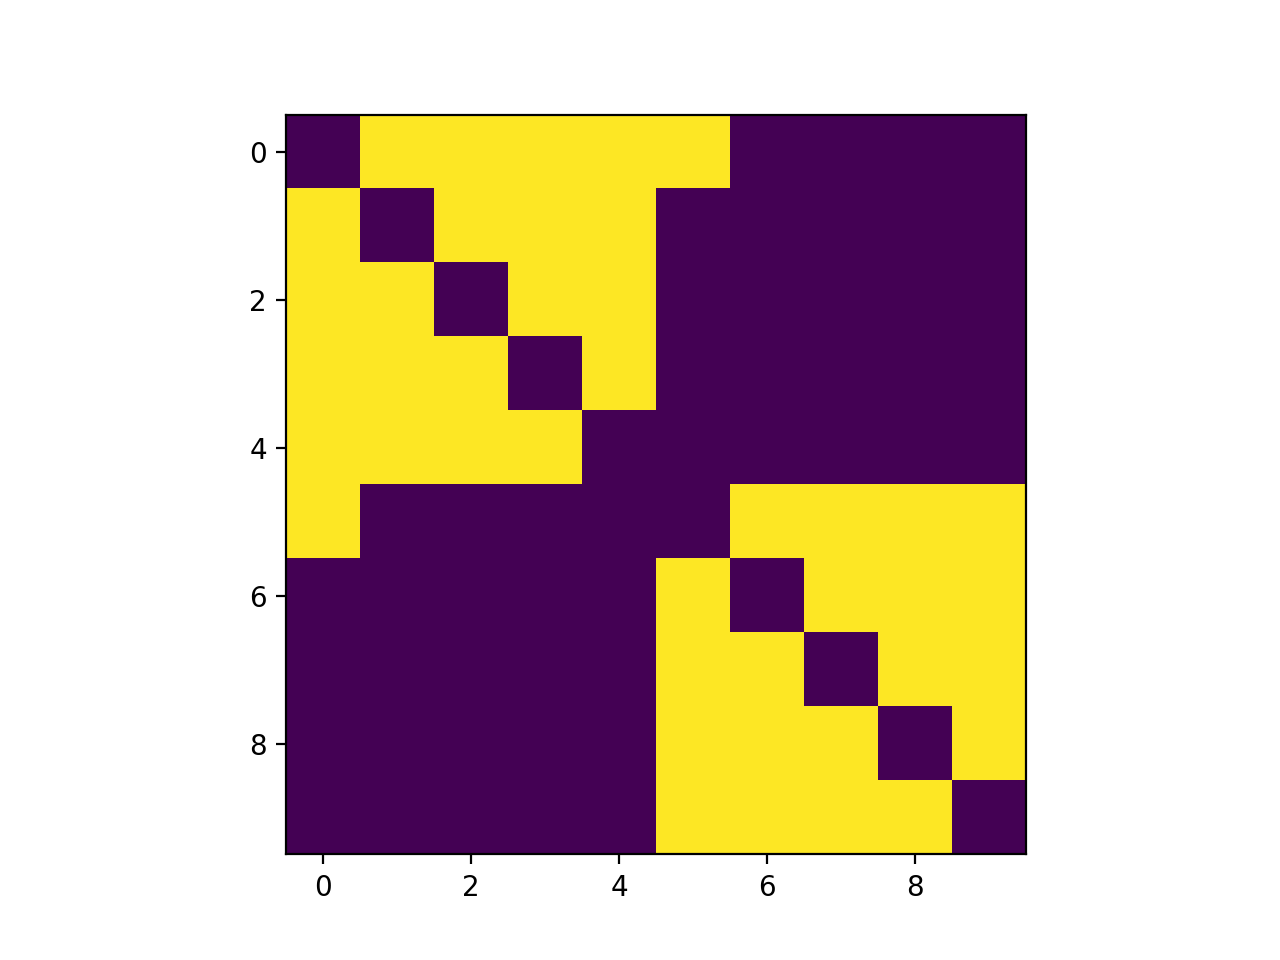
- graphy.graphgen.get_barbell_matrix(membership, num_conns=1)[source]
Get a matrix of completely-connected communities connected by paths corresponding to membership vector.
For example:
>>> from graphy import graphgen
>>> cmx = graphgen.get_barbell_matrix([0,0,0,0,0,1,1,1,1,1])
>>> import matplotlib.pylab as plt
>>> plt.imshow(cmx, interpolation='none')
(
Source code,png,hires.png,pdf)
- Parameters:
- membershiplist or np.array of ints
Array containing assignment of each node to communities
- num_connsint
Number of links that should run between communities
- Returns:
- np.array matrix
The connectivity matrix